Debugging JavaScript in Auth WebViews
There is a growing trend where authentication is occurring within browser controls in applications instead of through native UI. In general, this is good because it makes things like federation simpler, and lets you use different forms of authentication without requiring changes to native components.
This means any application you build can rely on a single authentication service and support a multitude of credential types without having to do anything in your own native app. Microsoft is all in with this through Azure AD, and through the ADAL (Azure Active Directory Authentication Libraries).
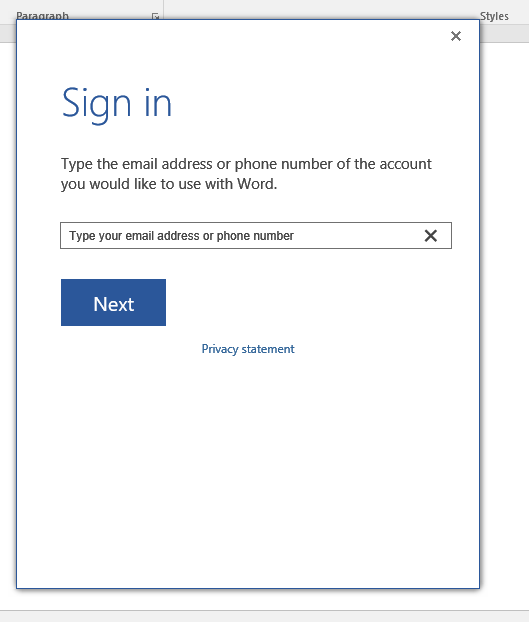
This is just rendered HTML.
Of course, there are problems with that. Paramount is that on Windows you’re more or less stuck with using the Internet Explorer WebBrowser Control. Now, IE has come a long way over the last few years to be standards compliant and overall it works really well. The story, however, is a little different when you’re using the WebBrowser control. That’s because the control defaults to IE 7 compatibility mode, meaning any HTML rendered through the control is interpreted by a — in the literal sense — retarded rendering engine. It really doesn’t function well and has no support whatsoever for any newer technologies.
Alternate title: Debugging JavaScript in Embedded Browsers on Windows.
There are ways you can fix this by using the X-UA-Compatible header or meta tag, or through the FEATURE_BROWSER_EMULATION registry key, but sometimes they both just fall short and you’re stuck troubleshooting just what the heck is going on in the page — and you don’t get the fancy F12 tools since it’s hosted in a process separate from a browser.
So how do you debug this thing? Thankfully Microsoft has a lot of debuggers, and most of them are available through Visual Studio. The process is pretty simple.
First, you need to enable script debugging in Internet Explorer (or disable-disabling script debugging) by unchecking both “Disable script debugging” options.
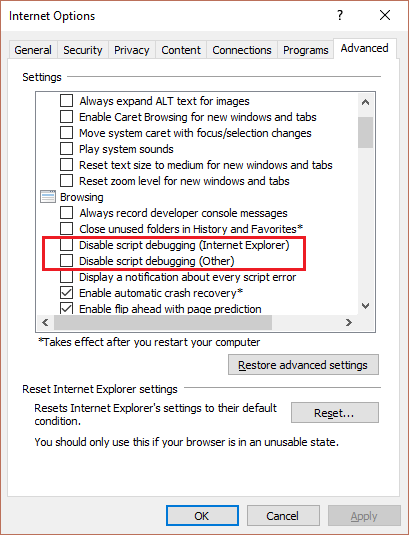
Enable Script Debugging
A word of advice — check these again when you’re done otherwise you’re going to see a lot of annoying pop ups asking to debug things.
Next, open Visual Studio and open the debugger Attach to Process window. Open the code Type Selection and switch to Script debugging.
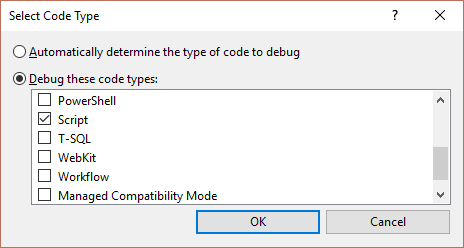
Script Debugging
Now attach the debugger to the offending process.
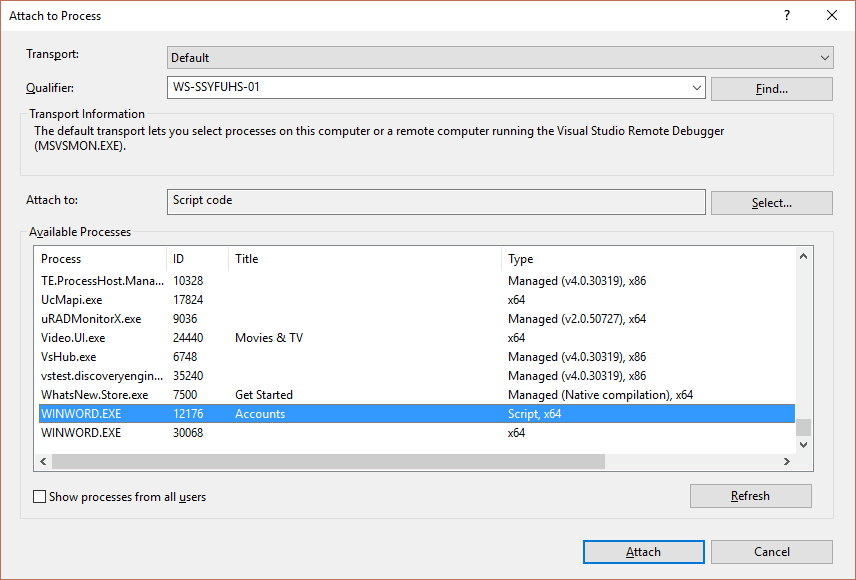
You are offensive, sir.
And cause something to explode.
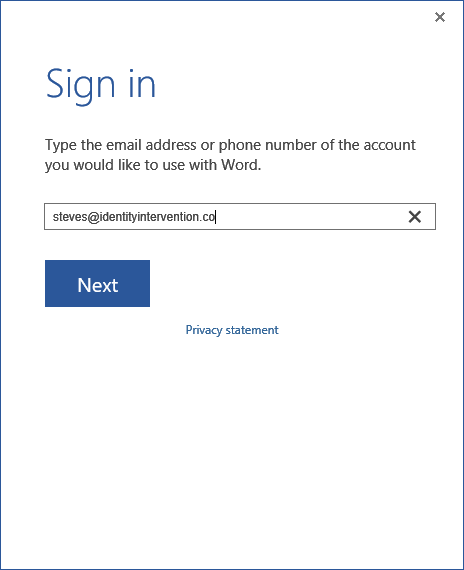
Let’s go offend someone!
And it explodes.
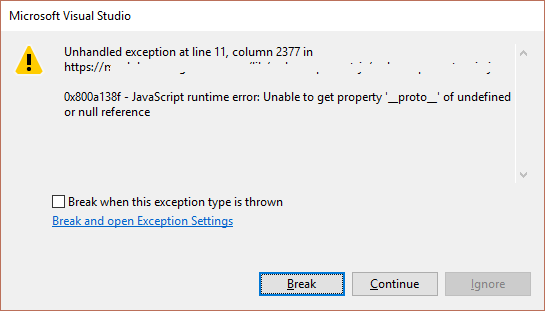
There goes the neighborhood.
Now you can break into the code and figure out what’s going on. The nice thing is that it’s a full debugger, so you have access to all the usual tools like the console.
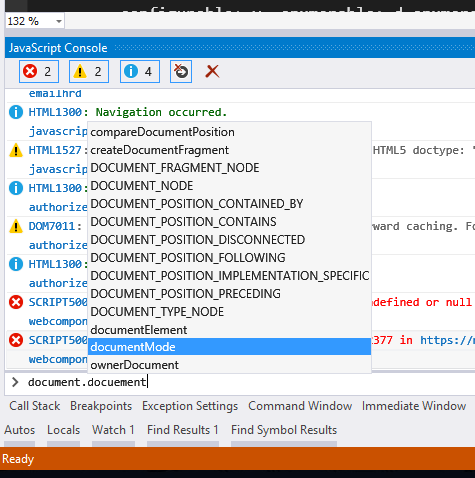
Consoling You as you debug.
Have fun.